
Wootrack Growth Blog
Google Ads Scaling Unprofitable Products: How POAS Stops It
Why Google Ads Keeps Promoting Your Worst Products
Here is the thing. Google Ads does not know what your products cost to fulfill. It sees revenue. It sees clicks. It sees conversions. And when it spots a product generating high conversion value relative to ad spend, it does exactly what it is designed to do – it scales that product hard.
The problem is that ‘high conversion value’ and ‘high profit’ are two completely different things for most WooCommerce stores. A product priced at €120 with €95 in combined COGS, shipping, Stripe fees, and VAT leaves you with €25 gross profit. If Google spends €30 in ads to sell it, you are €5 in the hole – even though the ROAS looks like a healthy 400%.
This is not a Google bug. It is a data problem. You are feeding Google revenue signals, so it optimizes for revenue. The algorithm is working perfectly. It is just working toward the wrong goal.
And the damage compounds quietly. Every day that Google’s Smart Bidding pushes budget toward your low-margin SKUs, it is pulling budget away from products that could actually grow your business. Your real winners – the ones with 60% margins and strong repeat purchase rates – get starved while the algorithm celebrates a €120 sale that cost you money to make.
The ROAS Trap: High Numbers, Negative Profit
ROAS is a ratio. It tells you how much revenue you generated per euro of ad spend. A 500% ROAS means €5 in revenue for every €1 spent. Sounds great. But ROAS has no idea what it cost you to deliver that €5.
Take a real example. You sell a €80 phone case. COGS is €28. Shipping is €6. PayPal takes 2.9% plus €0.30, so roughly €2.60. VAT at 21% on the margin adds another layer of complexity. By the time you account for everything, your true profit on that sale might be €18. If Google spent €20 in ads to drive it, your POAS is 90% – you are below break-even. But your ROAS? A shiny 400%.
That gap between ROAS and POAS is where stores bleed out. And most WooCommerce owners do not see it because they are looking at campaign-level ROAS in Google Ads, not per-product profit in their store backend.

POAS Product Labeling: The Fix That Actually Works
POAS – Profit on Ad Spend – flips the optimization signal. Instead of sending Google revenue as the conversion value, you send it actual profit. Now when Smart Bidding sees a conversion, it sees what you actually made. A €18 profit sale and a €2 profit sale look very different in the bidding algorithm. Google starts chasing the €18.
But sending profit values is only half the solution. The other half is labeling your products based on their POAS performance so you can control where your budget flows at the SKU level.
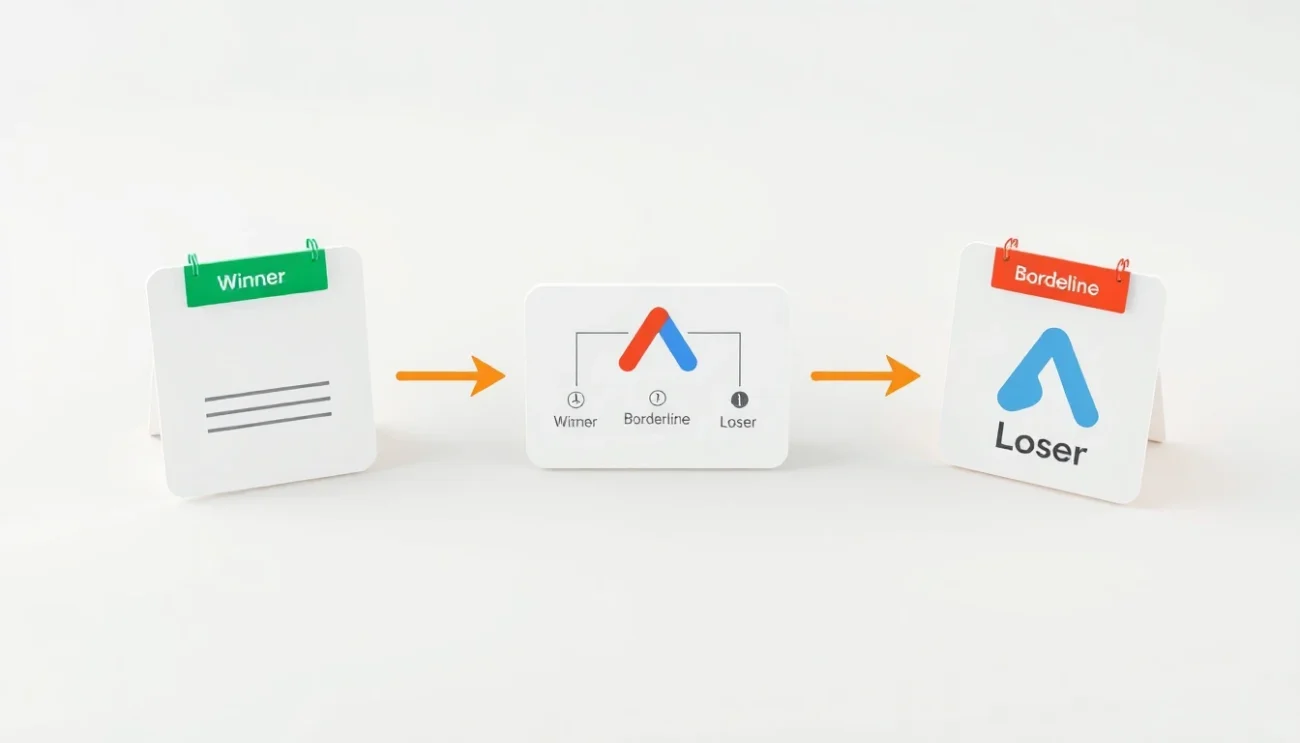
Winners, Borderline, Losers: The A/C/X Framework
WootrackApp uses a three-tier labeling system – A (Winners), C (Borderline), and X (Losers) – applied to every product in your WooCommerce catalog based on real POAS performance. These labels sync directly to your Google Shopping and Performance Max campaigns as custom labels.
Winners (A) are products with POAS consistently above your target threshold – say, 150% or higher. These get aggressive budget. Borderline (C) products sit near break-even and get conservative bids. Losers (X) are products where ad spend reliably produces negative profit. They get excluded or bid down to near zero.
This is not a manual process. WootrackApp calculates per-product profit by pulling your real costs from WooCommerce – COGS you set per SKU, live shipping rates, Stripe or PayPal or Klarna fees, and VAT for EU stores. It then maps those costs to actual orders, calculates true profit per conversion, and updates the A/C/X labels automatically as performance data accumulates.
The labels flow into Google Ads as custom label values. You set up separate asset groups or ad groups for each tier, with different target POAS or ROAS settings per tier. Google now has the structural signal it needs to allocate budget intelligently – not just by revenue, but by actual profitability.
Why Per-Product Profit Data Changes Everything
Campaign-level POAS can look healthy while individual SKUs destroy your margins. A campaign averaging 140% POAS might contain five products at 200%+ and three products at 60%. The winners are subsidizing the losers, and you cannot see it without per-product data.
WootrackApp’s per-product profit dashboard breaks this open. You can sort every SKU by POAS, by absolute profit generated, by ad spend consumed. The products quietly eating your budget while delivering sub-breakeven returns become impossible to miss.
The moment we stopped optimizing for ROAS and started labeling products by POAS, we cut 30% of our ad spend and our monthly profit went up. The losers were hiding inside a ‘healthy’ campaign average.
– WooCommerce store owner, home goods niche
How to Stop Google Ads From Scaling Your Losers
- 1
Set your real costs in WooCommerce
Enter COGS per SKU in WootrackApp. Connect your payment processor – Stripe, PayPal, Klarna – so fees are pulled automatically. Set your shipping cost logic and VAT rules if you are selling in the EU. This is the foundation. Without accurate costs, POAS is just a guess.
- 2
Let WootrackApp calculate true profit per order
Once costs are configured, the plugin calculates profit on every completed WooCommerce order. Not revenue, not margin – actual profit after every deduction. This happens automatically on each order, in real time.
- 3
Send profit values to Google Ads via offline conversions
WootrackApp pushes these profit figures to Google Ads as offline conversion values. Smart Bidding now sees real profit per conversion instead of revenue. This alone shifts how the algorithm allocates bids across your product catalog.
- 4
Review your A/C/X product labels
In the per-product profit dashboard, check which SKUs have been labeled as Winners, Borderline, or Losers. Give it at least 2-3 weeks of data before making structural campaign changes – you need enough conversions per product to trust the labels.
- 5
Restructure campaigns around profit tiers
Create separate Shopping or Performance Max asset groups for each label tier. Set aggressive POAS targets for Winners, conservative targets for Borderline, and either exclude Losers entirely or set bids so low they only capture near-zero-cost traffic. WootrackApp’s smart budget management can handle this scaling automatically.
- 6
Monitor and let the labels update
POAS labels are not static. A product that is a Loser in Q1 because of high shipping costs might become a Winner in Q3 when you renegotiate your carrier rates. WootrackApp recalculates and relabels continuously, so your campaign structure stays aligned with current reality.
Common Mistakes That Keep Losers in Your Campaigns
- Trusting campaign-level ROAS without drilling into per-product performance
- Using the same ROAS target for high-margin and low-margin product categories
- Ignoring payment processor fees – Stripe’s 2.9% + €0.30 per transaction adds up fast at scale
- Not accounting for VAT when calculating profit for EU sales
- Excluding products from campaigns manually instead of using label-based automation
- Setting POAS targets below 100% – anything under 100% means you are paying to lose money
- Waiting too long to cut Loser products – every week of delay is real money gone
- Assuming a product with high impressions and clicks must be profitable
Frequently asked questions
How does Google Ads end up scaling my least profitable products?
Google’s Smart Bidding optimizes for conversion value – which by default is your product revenue. Products with high revenue per click get more budget, regardless of what they cost to fulfill. A €150 product with €140 in costs looks great to Google’s algorithm. It has no visibility into your margins unless you send profit as the conversion value, which is exactly what POAS bidding via offline conversions does.
What is the difference between ROAS and POAS for WooCommerce stores?
ROAS (Return on Ad Spend) divides revenue by ad spend. POAS (Profit on Ad Spend) divides actual profit – after COGS, shipping, payment fees, and VAT – by ad spend. A product can have 600% ROAS and 70% POAS simultaneously, meaning you are generating strong revenue but losing money on every sale. POAS is the metric that tells you whether you are actually making money from Google Ads.
What does a POAS of 100% mean?
100% POAS is break-even. For every €1 you spend on ads, you generate €1 in true profit – meaning ad spend is exactly covered by the profit on the sales it drives. You want to be above 100% to actually grow. A 150% POAS means €1.50 profit per €1 of ad spend. Below 100% means you are paying Google to lose money on each sale.
How does WootrackApp calculate profit per product?
WootrackApp pulls COGS from your WooCommerce product settings, fetches payment processor fees automatically from Stripe, PayPal, or Klarna, applies your configured shipping costs, and handles VAT calculations for EU stores. On every completed order, it calculates the true profit – revenue minus all those costs – and attributes it to the specific SKUs in that order. This gives you a per-product profit figure that reflects reality, not just margin estimates.
Can I use POAS labeling with Performance Max campaigns?
Yes. WootrackApp’s A/C/X product labels sync to Google Ads as custom label values, which you can use to segment products into separate Performance Max asset groups or Shopping ad groups. Each segment can have its own POAS target, so Winners get aggressive budgets and Losers get minimal or zero spend. WootrackApp also handles auto campaign creation, so you do not have to build this structure manually from scratch.
How long does it take to see results after switching to POAS bidding?
Most stores see Smart Bidding begin shifting its behavior within 2-4 weeks of sending profit conversion values. The A/C/X labels need at least 2-3 weeks of order data per product to be reliable. Budget reallocation away from Losers typically shows measurable profit improvement within 30-60 days, depending on your catalog size and conversion volume. Stores with high SKU counts and thin margins often see the biggest early gains.