Google Ads Profit Per Product WooCommerce: Stop Funding Losers
Wootrack Growth Blog
Google Ads Profit Per Product WooCommerce: Stop Funding Losers
The Google Ads Profit Per Product Problem Every WooCommerce Store Has
Here is a scenario that plays out in thousands of WooCommerce stores every single month. You open Google Ads, see a product sitting at 600% ROAS, and feel good about it. That product is your top spender, your campaign anchor, the one Google keeps pushing budget toward. It looks like a winner.
It is not.
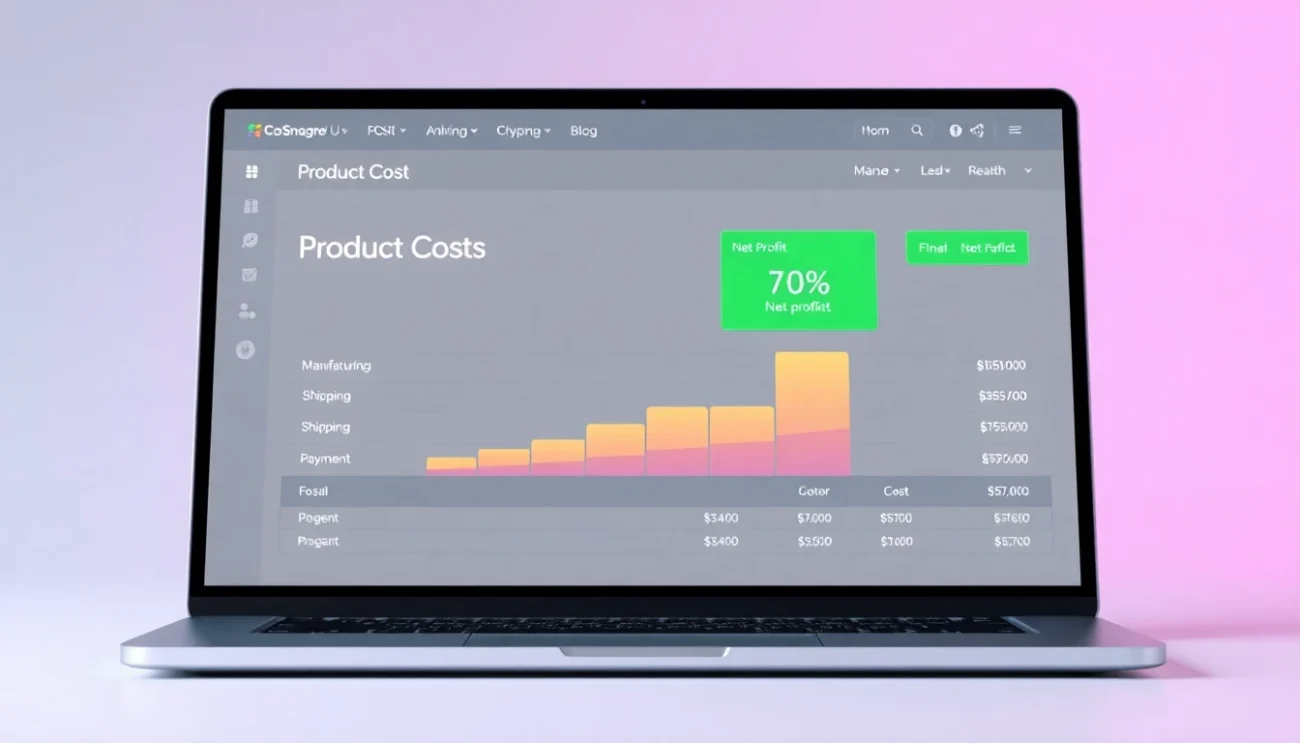
Strip out COGS, subtract the Stripe fee (2.9% + €0.30), add the shipping cost you absorbed to stay competitive, and apply VAT if you are selling into the EU. That 600% ROAS product is earning you 8% net margin per sale. On a €50 order, that is €4. Google spent €8.33 to generate that sale at 600% ROAS. You lost money.
Meanwhile, a slower-moving niche product sits at 280% ROAS. Google barely touches it. But after costs, every sale drops €18 pure profit into your pocket. That product is your actual business. Google just does not know it.
This is not a bidding problem. It is a data problem. Google optimizes on the signal you give it. If you give it revenue, it chases revenue. The fix is giving it profit instead – per product, per order, in real time.
Why ROAS Hides the Margin Gap Between Products
ROAS treats a €50 sale and a €50 sale as identical. But one product might have a 60% gross margin and another a 15% gross margin. Throw in variable shipping costs, payment processor fees that scale with order value, and product-specific return rates, and two products with the same ROAS can have wildly different profit outcomes.
Google Shopping and Performance Max campaigns do not have visibility into any of this. They see conversion value – the order total you pass through your tracking tag – and they optimize to maximize it. The result is a campaign that is technically performing but financially bleeding you out.
How to Build a Per-Product Profit View That Google Ads Can Actually Use
- 1
Map real costs to every product SKU
Start with COGS – the actual landed cost of each unit, including manufacturing, supplier price, and inbound freight. This number lives in your WooCommerce product data. Then layer in product-specific shipping costs. A heavy item costs more to ship than a small accessory, and that difference matters when you are calculating margin.
- 2
Account for payment and platform fees at the order level
Stripe, PayPal, and Klarna all take a cut that scales with order value. On a €200 order, Stripe alone takes €6.10. That is not a rounding error. WootrackApp pulls these fees automatically per order so the profit figure is always accurate, not estimated.
- 3
Calculate true net profit per order and attribute it to each product
Once you have revenue minus COGS minus shipping minus payment fees minus VAT (for EU stores), you have real profit. The key step is attributing that profit value to the Google Ads click that drove the order. This is what POAS bidding runs on.
- 4
Send profit as the conversion value to Google Ads
Instead of passing order revenue as your conversion value, pass profit. Google’s Smart Bidding then optimizes to maximize profit, not revenue. This is done via offline conversions – WootrackApp handles the upload automatically after each order is processed in WooCommerce.
- 5
Label products by per-product POAS and adjust campaign structure
Once you have per-product profit data flowing, you can classify every product as a Winner (A), Borderline (C), or Loser (X) based on its POAS. WootrackApp syncs these labels directly to your Google Ads campaigns so budget naturally shifts toward A products and away from X products.
Reading Per-Product POAS Data and Acting on It
Once you have real profit flowing into Google Ads and a per-product POAS dashboard, the picture changes fast. You stop managing campaigns by ROAS and start managing by margin contribution.
A product at 180% POAS is generating €0.80 profit for every €1 you spend on ads. That is your floor – anything below 100% is a loss. A product at 220% POAS is generating €1.20 per €1 spent. Scale it. A product at 70% POAS is destroying capital. Cut it or fix the margin before running ads on it.
The A/C/X Framework for WooCommerce Product Profit Tracking in Google Ads
WootrackApp uses a three-tier labeling system built directly on per-product POAS. A products are your winners – high profit per sale, strong POAS, worth scaling aggressively. C products are borderline – they are covering costs but not generating meaningful profit. X products are losers – negative or near-zero POAS after all costs.
These labels sync to your Google Ads campaigns automatically. A products get higher bids and more budget. X products get suppressed or excluded entirely. You do not have to manually adjust campaign settings every week – the system does it based on actual profit data from WooCommerce.
This is where WooCommerce product profit tracking in Google Ads moves from theory to execution. The labels are not static. As costs change, as margins shift, as new products launch, the classification updates and the campaigns adjust.
Scaling Winners Without Killing Their Margin
Scaling a profitable product is not just about raising the budget. As you push more spend into a campaign, Google starts reaching lower-intent audiences and your conversion rate drops. POAS drops with it.
The right approach is to scale in steps – increase budget by 15-20% at a time and watch the POAS response over 7-10 days. WootrackApp’s smart budget management does this automatically, scaling spend on A products while monitoring POAS to make sure you are not crossing into unprofitable territory. If POAS drops below your threshold, the system pulls back.
Revenue tells you what happened. Profit tells you whether it was worth it. Every WooCommerce store running Google Ads needs per-product profit visibility before they can make rational bidding decisions.
– Ecommerce Growth Strategist / WooCommerce Ads Specialist
Stop Google Ads Wasting Budget on Losers: The Replicable System
The pattern across stores that fix this problem is consistent. They start by pulling COGS data into WootrackApp, connect their payment processor so fees are captured automatically, and within 48 hours they have a per-product profit dashboard that shows the actual margin on every SKU.
The first reaction is almost always the same: shock at which products are actually profitable. The high-volume, high-ROAS products are rarely the winners. The niche items with lower search volume and fewer clicks often carry 3-4x the profit per sale.
From there, the system runs itself. WootrackApp sends profit values to Google Ads via offline conversions, Smart Bidding recalibrates over 2-3 weeks, and budget starts flowing toward the products that earn it. You are not guessing anymore. You are optimizing on real numbers.
One more thing worth saying: this is not a one-time fix. Costs change. Supplier prices shift. Shipping rates go up. Payment processors update their fee structures. A static COGS spreadsheet goes stale within weeks. The value of having WootrackApp connected to your live WooCommerce data is that the profit calculations stay current without manual updates.
Per-Product Profit Audit: What to Check Before Your Next Campaign Adjustment
- COGS is entered for every active product SKU in WooCommerce – not estimated, actual landed cost
- Shipping cost is tracked per product or per order weight, not as a flat average
- Payment processor fees (Stripe, PayPal, Klarna) are captured at the order level, not assumed
- VAT is excluded from profit calculations if you are an EU seller passing tax to the customer
- Each product has a calculated POAS over the last 30 days, not just a ROAS figure
- Products below 100% POAS are identified and either excluded from campaigns or flagged for margin review
- A/C/X labels are applied in Google Ads and budget allocation reflects product profitability
- Conversion values sent to Google Ads represent profit, not revenue
Frequently asked questions
Why does Google Ads keep promoting my lowest-margin products?
Because Google optimizes on the conversion value you send it, which is almost always order revenue. A high-price, low-margin product looks identical to a high-price, high-margin product from Google’s perspective. The fix is sending profit as the conversion value instead of revenue, so Smart Bidding learns to favor products that actually generate profit after costs.
How do I calculate per-product POAS in WooCommerce?
Per-product POAS is calculated as (profit generated by ad clicks on that product) divided by (ad spend on that product), expressed as a percentage. WootrackApp automates this by pulling COGS, shipping, and payment fees from WooCommerce, calculating profit per order, attributing it to the product that was clicked, and displaying it in the per-product profit dashboard.
What is the difference between ROAS and POAS for WooCommerce stores?
ROAS measures revenue returned per ad dollar spent. POAS measures profit returned per ad dollar spent. A 500% ROAS sounds great but if your margin is 15%, your POAS is around 75% – meaning you are losing money on every sale. POAS at 100% is break-even. Anything above 100% means you are generating profit from ad spend.
Can I use WootrackApp with Performance Max campaigns?
Yes. WootrackApp works with both Google Shopping and Performance Max. It sends profit-based offline conversions to Google Ads regardless of campaign type, so Smart Bidding in PMax campaigns receives the same profit signal and optimizes accordingly. The A/C/X product labels also sync to PMax campaign asset groups.
How long does it take for Smart Bidding to respond to profit-based conversion values?
Google’s Smart Bidding typically needs 2-4 weeks of data to recalibrate after you switch from revenue to profit as your conversion value. During this period, you may see some volatility in performance metrics. After the learning phase, campaigns generally shift budget toward higher-POAS products and reduce spend on low-margin items.
What if my product costs change frequently – will the profit tracking stay accurate?
This is one of the main reasons to use a connected tool rather than a static spreadsheet. WootrackApp pulls cost data from your live WooCommerce product records, so when you update COGS or shipping costs in WooCommerce, the profit calculations update automatically. Payment processor fees are also captured per transaction, not estimated, so the numbers stay current.